Unpacking Technical Analysis
Technical analysis, at its core, can be likened to the intricate decoding of a market's historical diary. As investors, we are presented with a canvas filled with numbers, patterns, and graphs. These aren't random brush strokes but rather a meticulous recounting of the market's mood swings, fears, elations, and contemplations. In the vast realm of investing, technical analysis emerges as a dynamic and data-driven approach to interpret these past stories, converting raw data into actionable insights.
Navigating market memory and behavioral patterns
The beauty of technical analysis lies not in its ability to prophesy, but in its power to analyze the market's memory. Instead of gazing into a crystal ball to predict the future, it leans heavily on assessing past market data, especially price and volume, to discern potential market trends. This method holds that within this historical data lies the collective behavior of the market, encapsulating the wisdom (and sometimes the folly) of its participants.
By diving into this rich history, investors are offered a clearer lens to gauge where the market might head next. The patterns observed are not just repetitive sequences but are reflections of consistent human behavior in response to certain stimuli. In a world where emotions often dictate financial decisions, technical analysis stands as a beacon, guiding investors through the tumultuous seas of market volatility with the steadiness of data and pattern recognition.
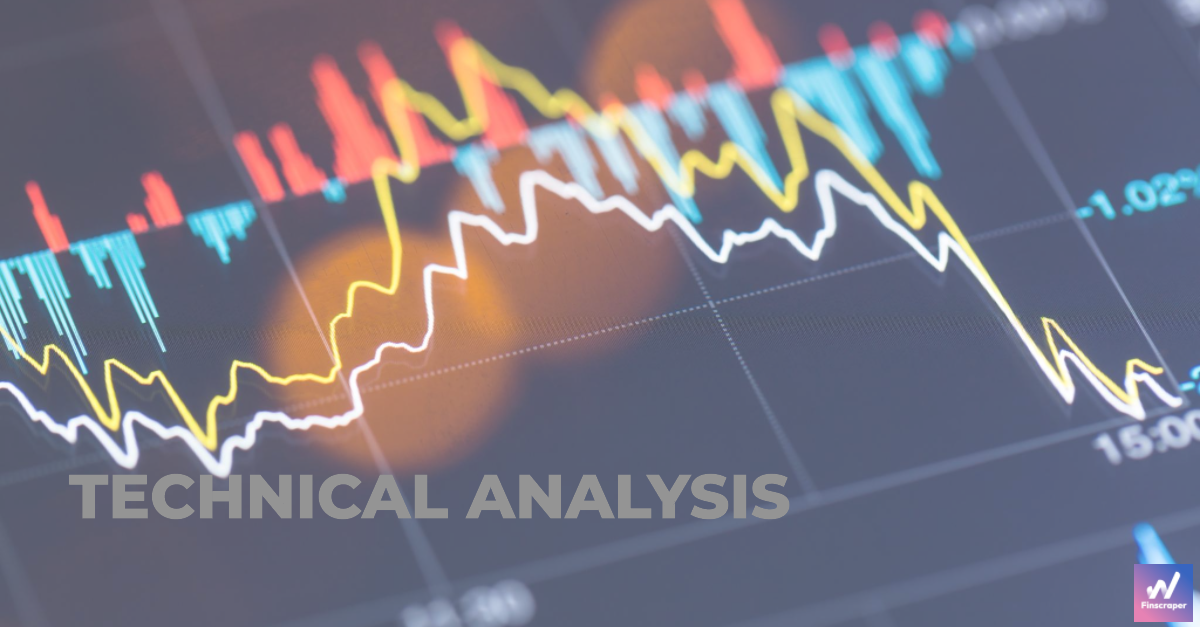
Peeling back the layers
Let’s now delve deeper into this intriguing domain. Imagine you're a software engineer who's recently received a substantial bonus from a successful project. You decide to invest a part of it, but with the guidance of technical analysis.
Now, how would you apply this method? Technical analysis believes in market efficiency, implying all known data is reflected in an asset’s price. This results in patterns pointing to future behaviors. Tools like charts, especially dynamic ones on platforms like Finscraper, help you track asset price movements over time.
Dive into phases like 'consolidation', anticipate breakout directions using volume data, and familiarize yourself with various indicators such as Moving Averages. Chart patterns like 'Head and Shoulders' or 'Cup and Handle' will become part of your investing vocabulary. For those beginning this journey, 'A Beginner's Guide to the Stock Market' by Matthew R. Kratter can be your compass.
Your partner in investment journey
Remember, this journey isn't a solitary one. With platforms like Finscraper, you can not only monitor your portfolio effectively but also access advanced tools to assist you in your technical analysis. By providing you with comprehensive data and user-friendly tools, Finscraper is designed to aid you in your decision-making process.
In conclusion, technical analysis is an empowering tool for modern investors. Knowledge remains your ultimate asset. With Finscraper by your side, your decisions become not just informed but strategic and potent.